|
|
|
|
|||||
|
|
|||||||
| |
|
|
|
|
|
||
|
|
|
|
|
|
|
|
|
|
2007 combined ANU/Uni of Adelaide undergraduate regolith-landform mapping area: |
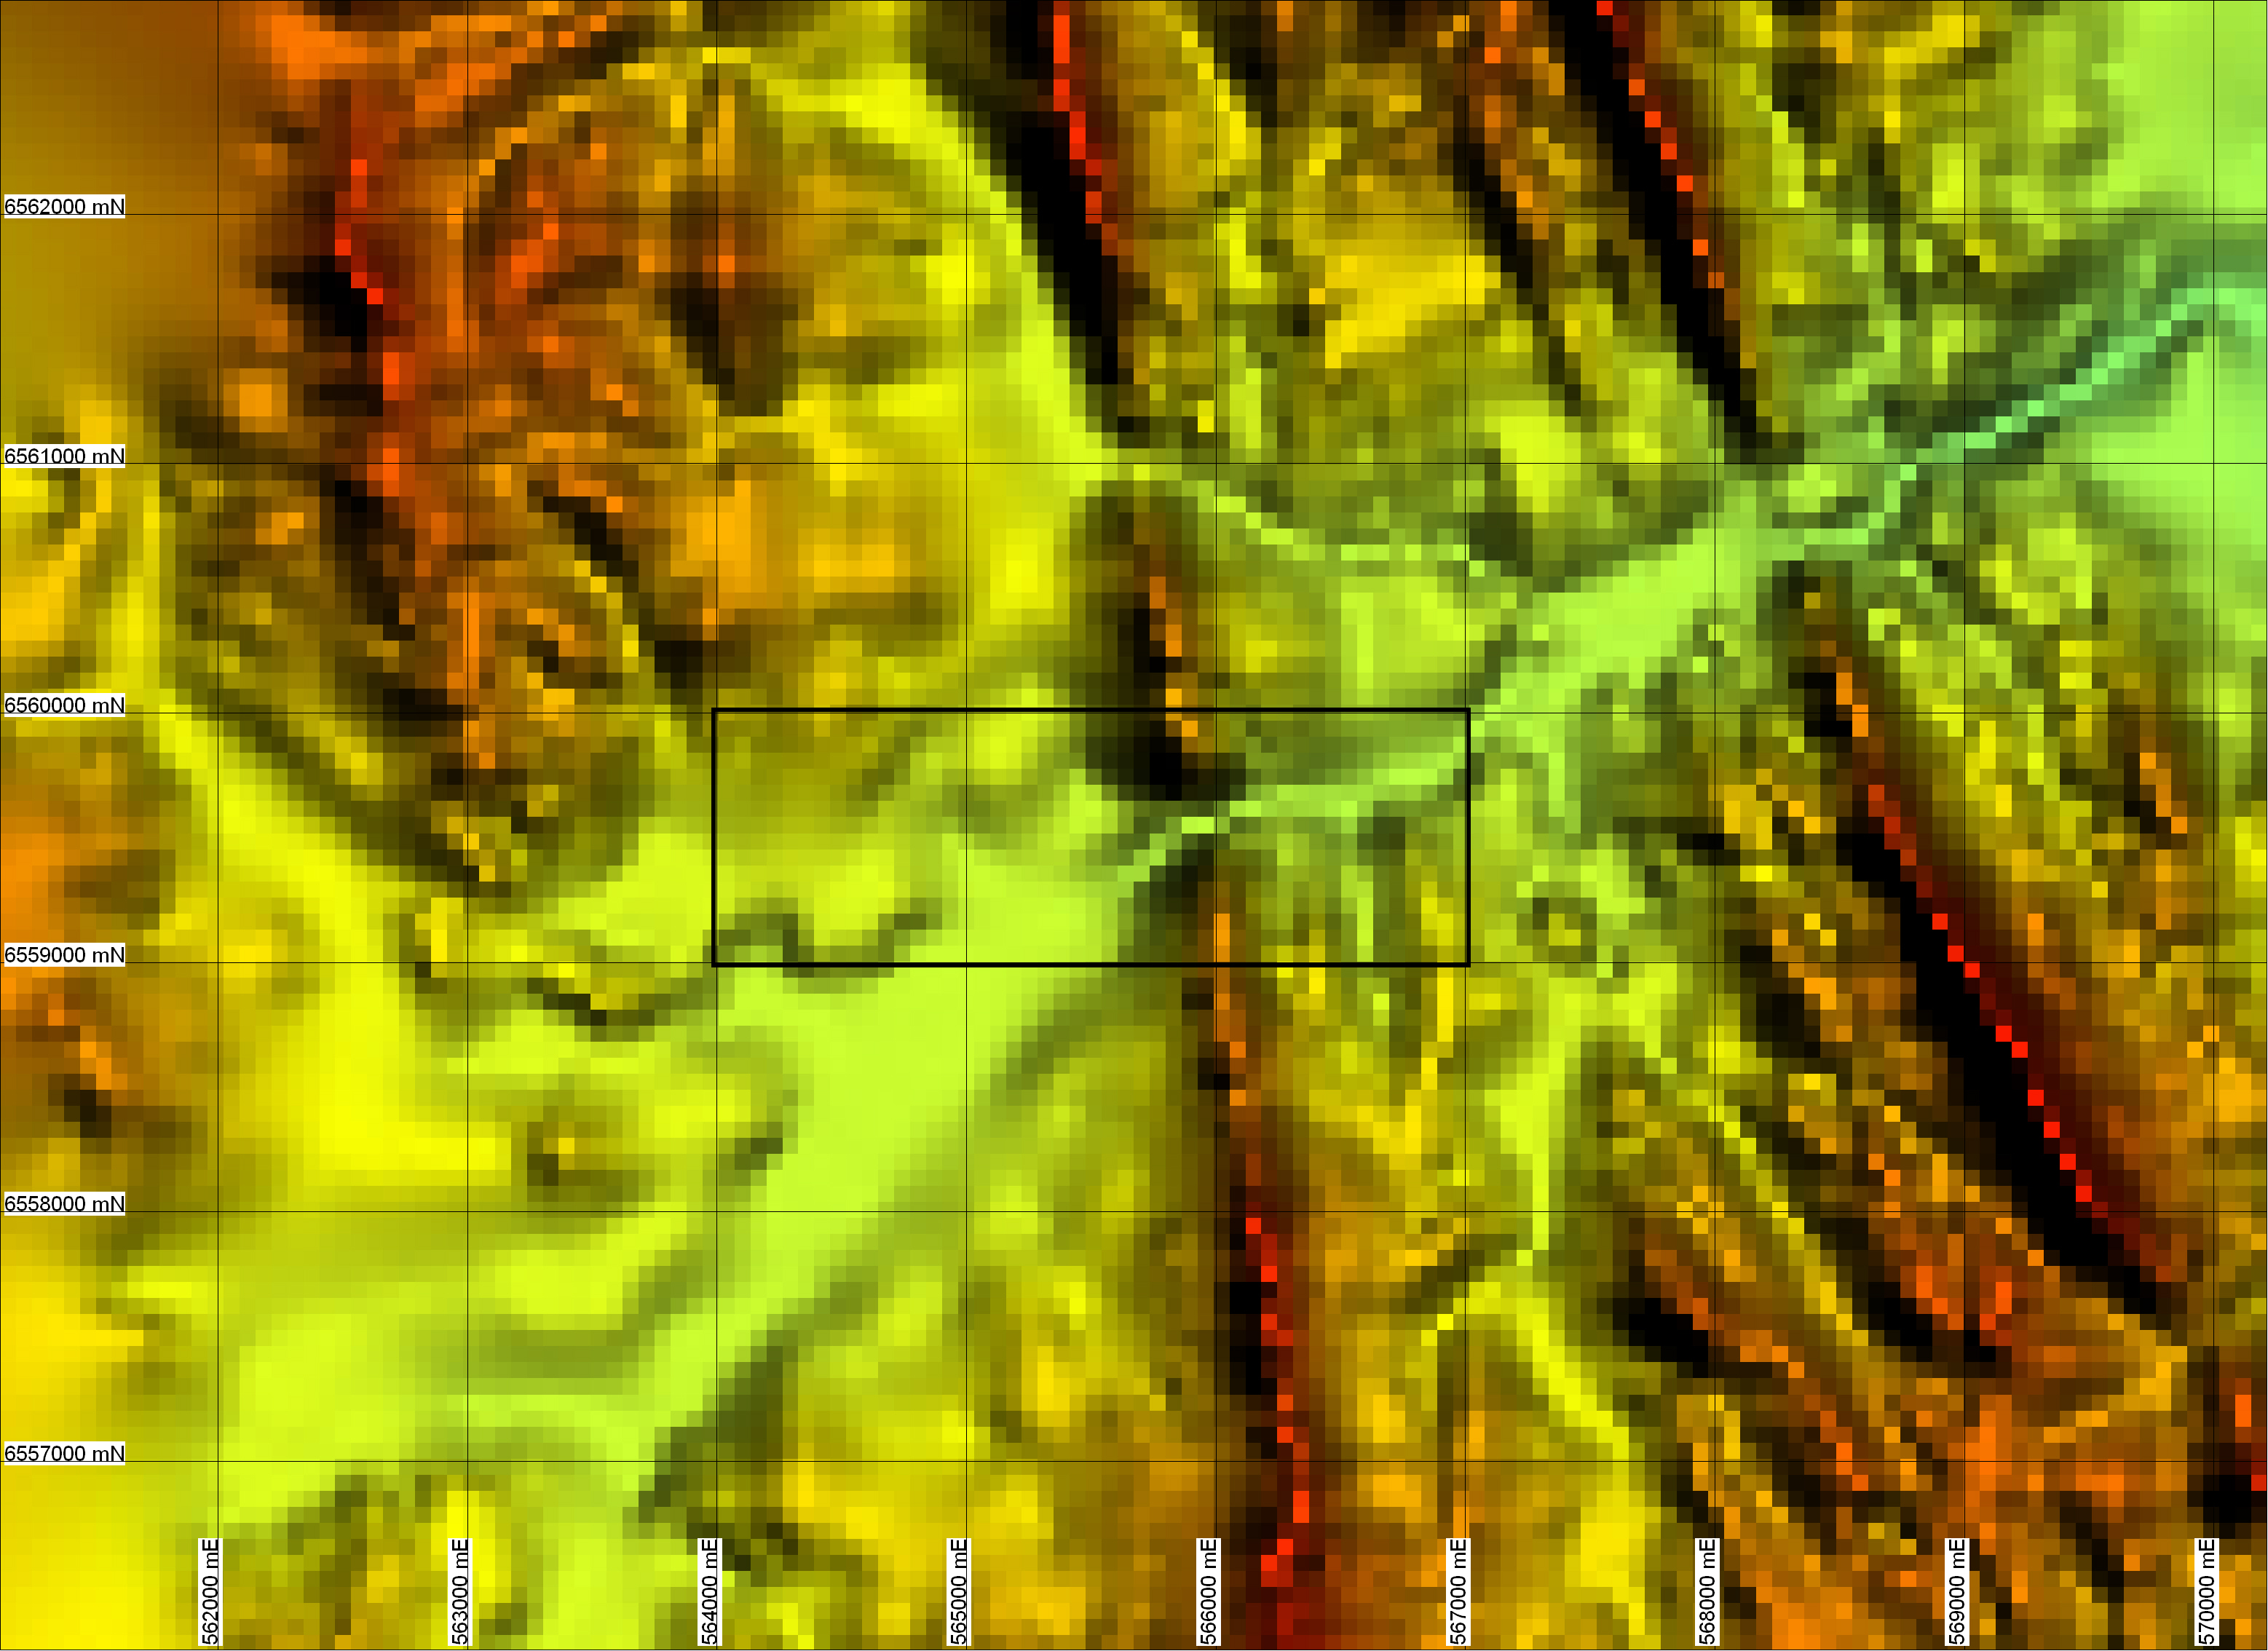 |
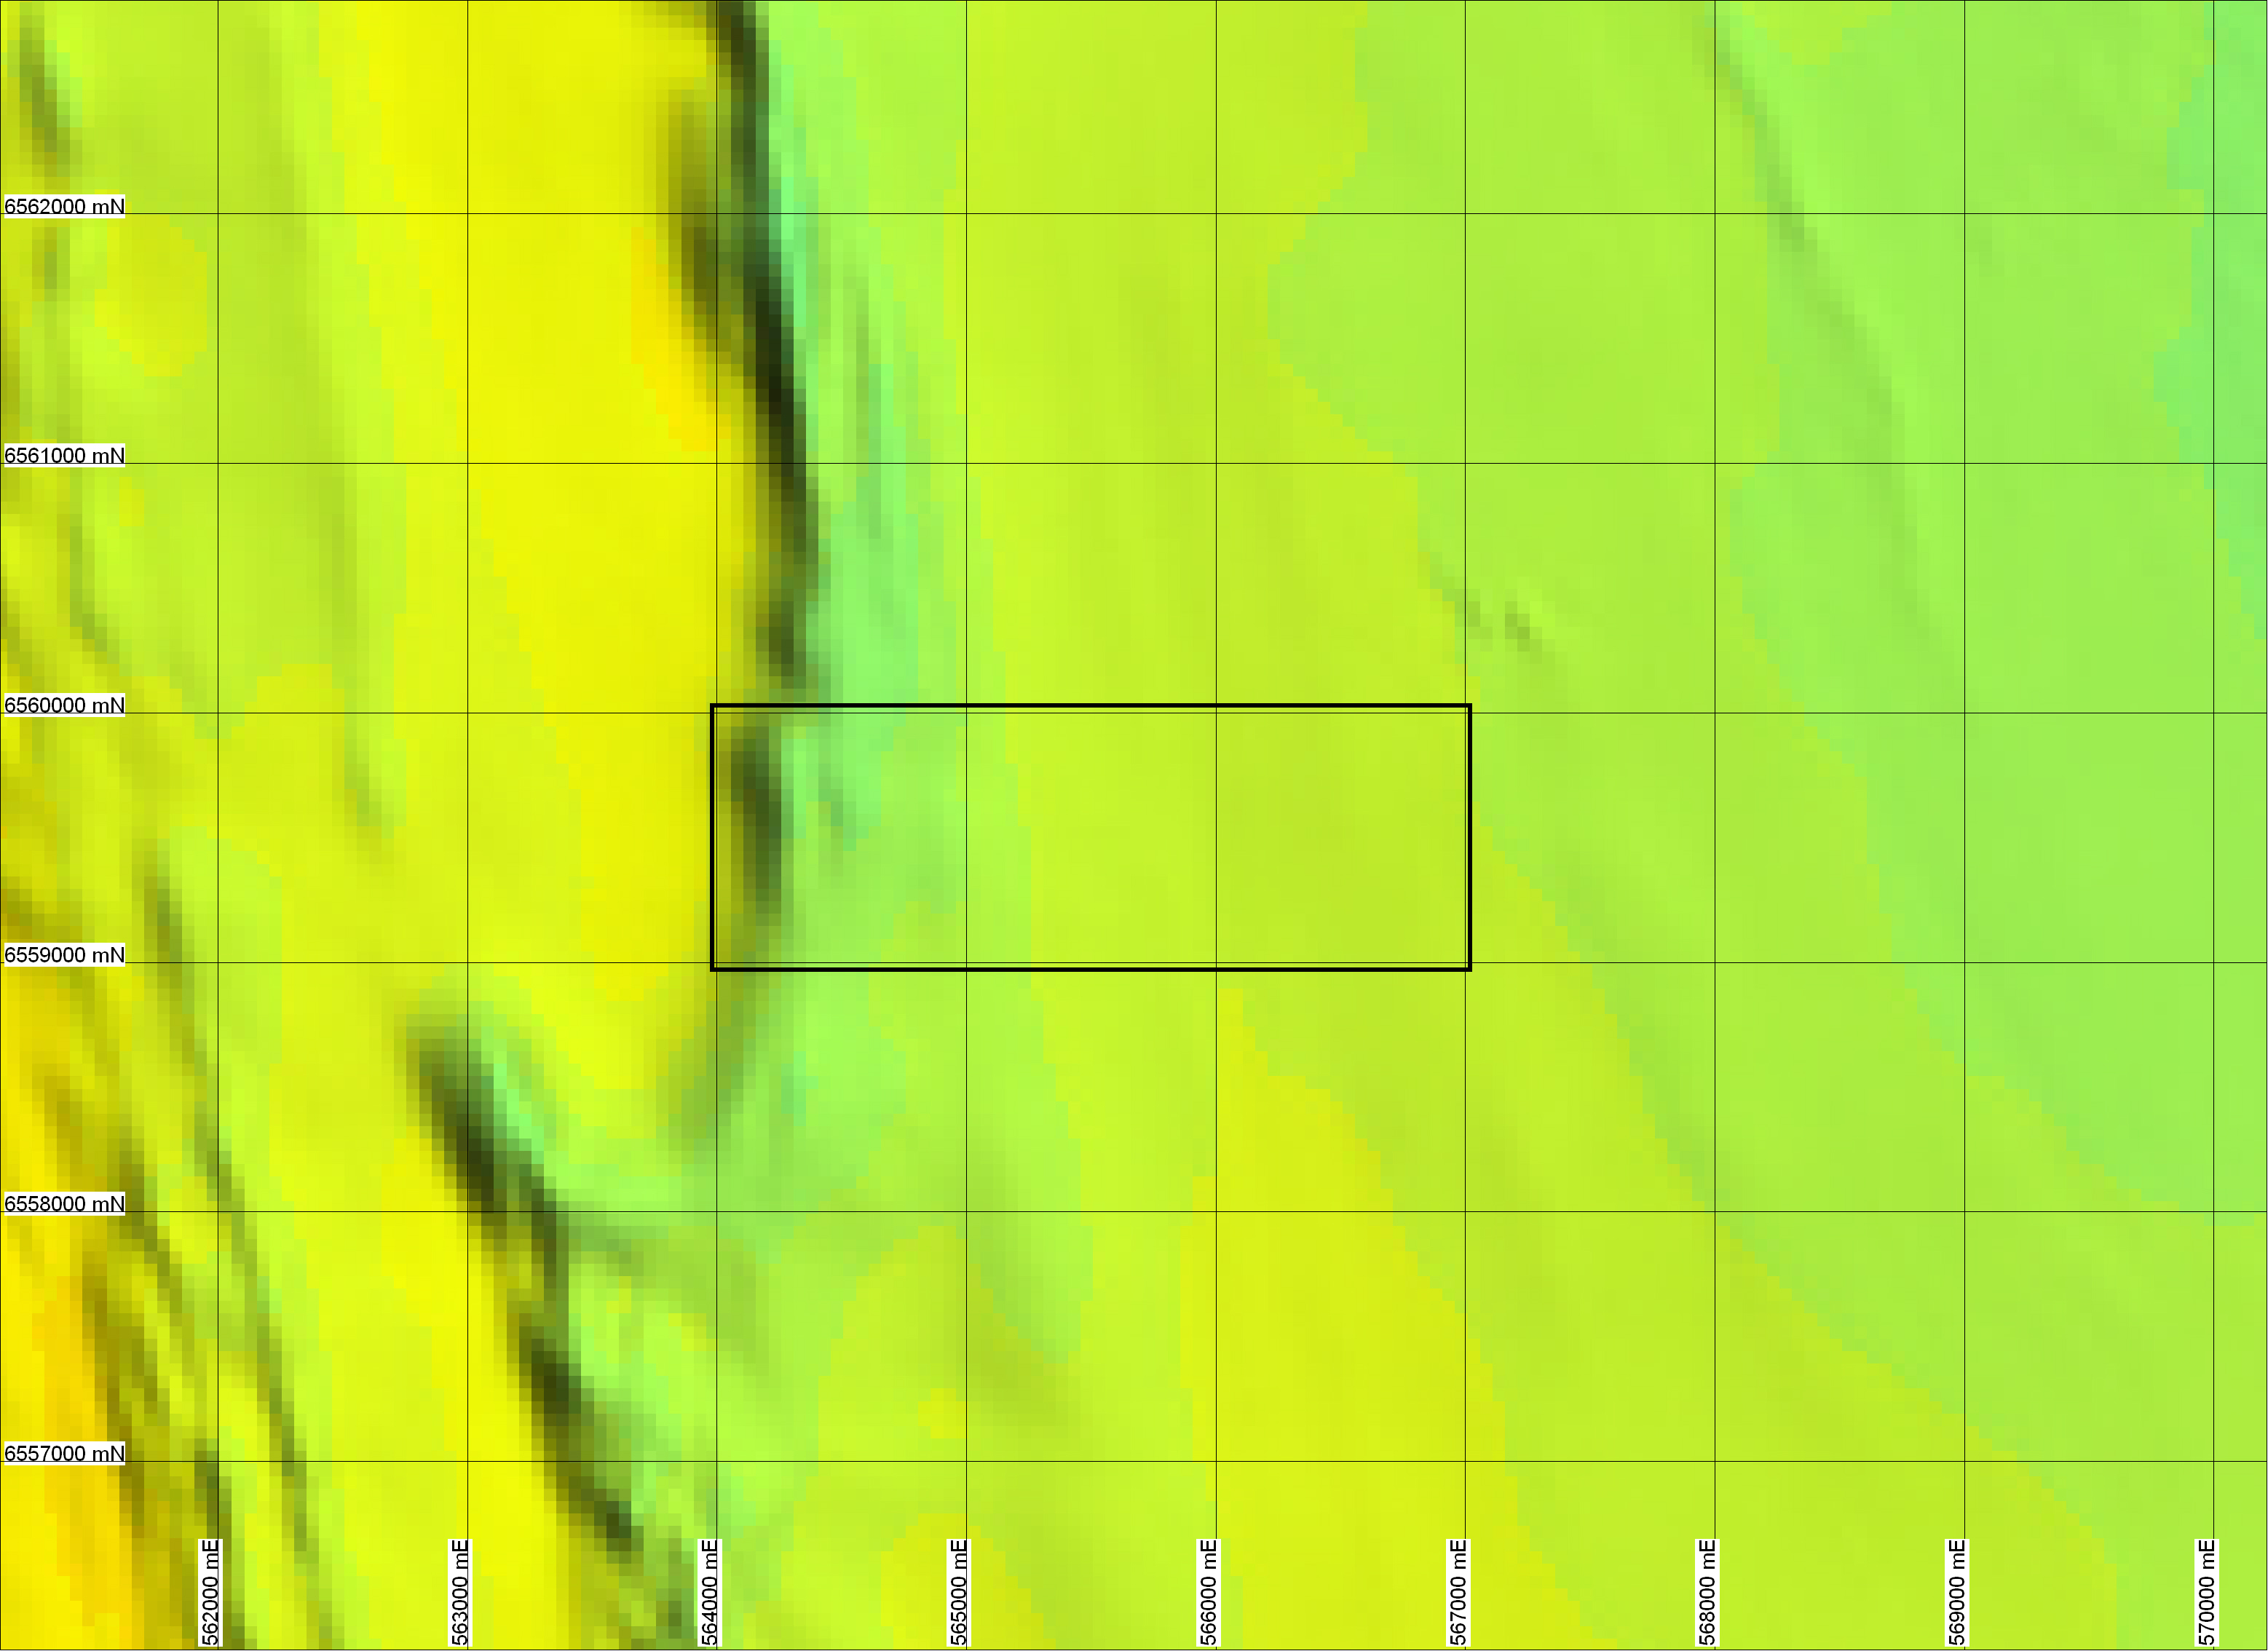
Digital Elevation Model
(300 dpi jpg, 2.2 Mb) This Digital Elevation Model (DEM) is derived from a combination of 5 m topographic contours from the 1971 1:25,000 topographic sheets and the Space Shuttle Radar Topographic Mission (SRTM) DEM. The DEM has 25 m cells which are based primarily on the topographic contours. The SRTM data, with 90 m cells, were used to fill in gaps where topographic contours were more than 50 m apart. The DEM was constructed using Discover, a third-party software package for MapInfo GIS. It has nicely filtered out all the lumps and bumps from the digital noise in the SRTM data, but has left in some steps in areas with low relief. This is an artefact of the contouring process and is unavoidable given the data used. |
 |
ASTER Bands 3N21
(VNIR) 99% stretch (300 dpi jpg, 2.5 Mb) ASTER (the Advanced Spaceborne Thermal Emission and Reflection Radiometer) is one of two working instruments on the NASA TERRA satellite (the other being MODIS). ASTER senses 14 bands from visible near infra-red to thermal infra-red and has resolutions varying from 15 m (VNIR) to 90 m (TIR). ASTER is extremely useful for mapping regolith and vegetation in the arid and semi-arid zones at scales as high as 1:25,000 (where it become a little pixelated). This image has a 99% histogram stretch (performed using ER-Mapper) and highlights vegetation growing along drainage lines and around "The Lake". Different surface materials can also be picked out. The images shows colluvium and alluvium sheeting off the ridges, Adelaidean bedrock geology, the alluvial plains either side of Fowlers Creek and colluvial/bedrock uplands. This image comes from the NASA LP-DAAC. |
 |
Airborne radiometrics
(gamma-ray spectrometrics) (300 dpi jpg, 2.6 Mb) Airborne radiometrics is a measure of the gamma-ray emittance of the top 30-50 cm of the Earth (the regolith). Emitance of the radioisotopes potassium (K), thorium (Th) and uranium (U) are coloured red, green and blue, respectively, in these images. The image highlights the sources and sinks of surface materials including: dark (no emittance) water bodies of Freislich Dam and The Lake; low-emittance materials from the prominent quartzite ridges; the yellow-white coloured Adelaidean metasediments; greenish coloured highly ferruginised Adelaidean bedrock and colluvium; and, K-rich sediments being transported west-to-east by Fowlers Creek. This image comes from the New South Wales' Department of Primary Industry's Koonenberry Volume 1 dataset. |
 |
Total Magnetic Intensity
(TMI) (300 dpi jpg, 1.1 Mb) TMI is a measure of the total magnetic field of the Earth, whether it be induced or remnant, here presented as coloured, sun-shaded reduced-to-pole (RPT). RTP is a mathematical process that moves magnetic anomalies back to lie above their origins by recalculating the declination (plunge) of the Earth's magnetic field, making it vertical, rather than non-vertically plunging. This image highlights large magnetic bodies in the basement rocks, including highly ferruginised Adelaidean bedrocks in the west of the mapping area. This image comes from the New South Wales' Department of Primary Industry's Broken Hill Exploration Initiative (BHEI) Volume 2 dataset. |
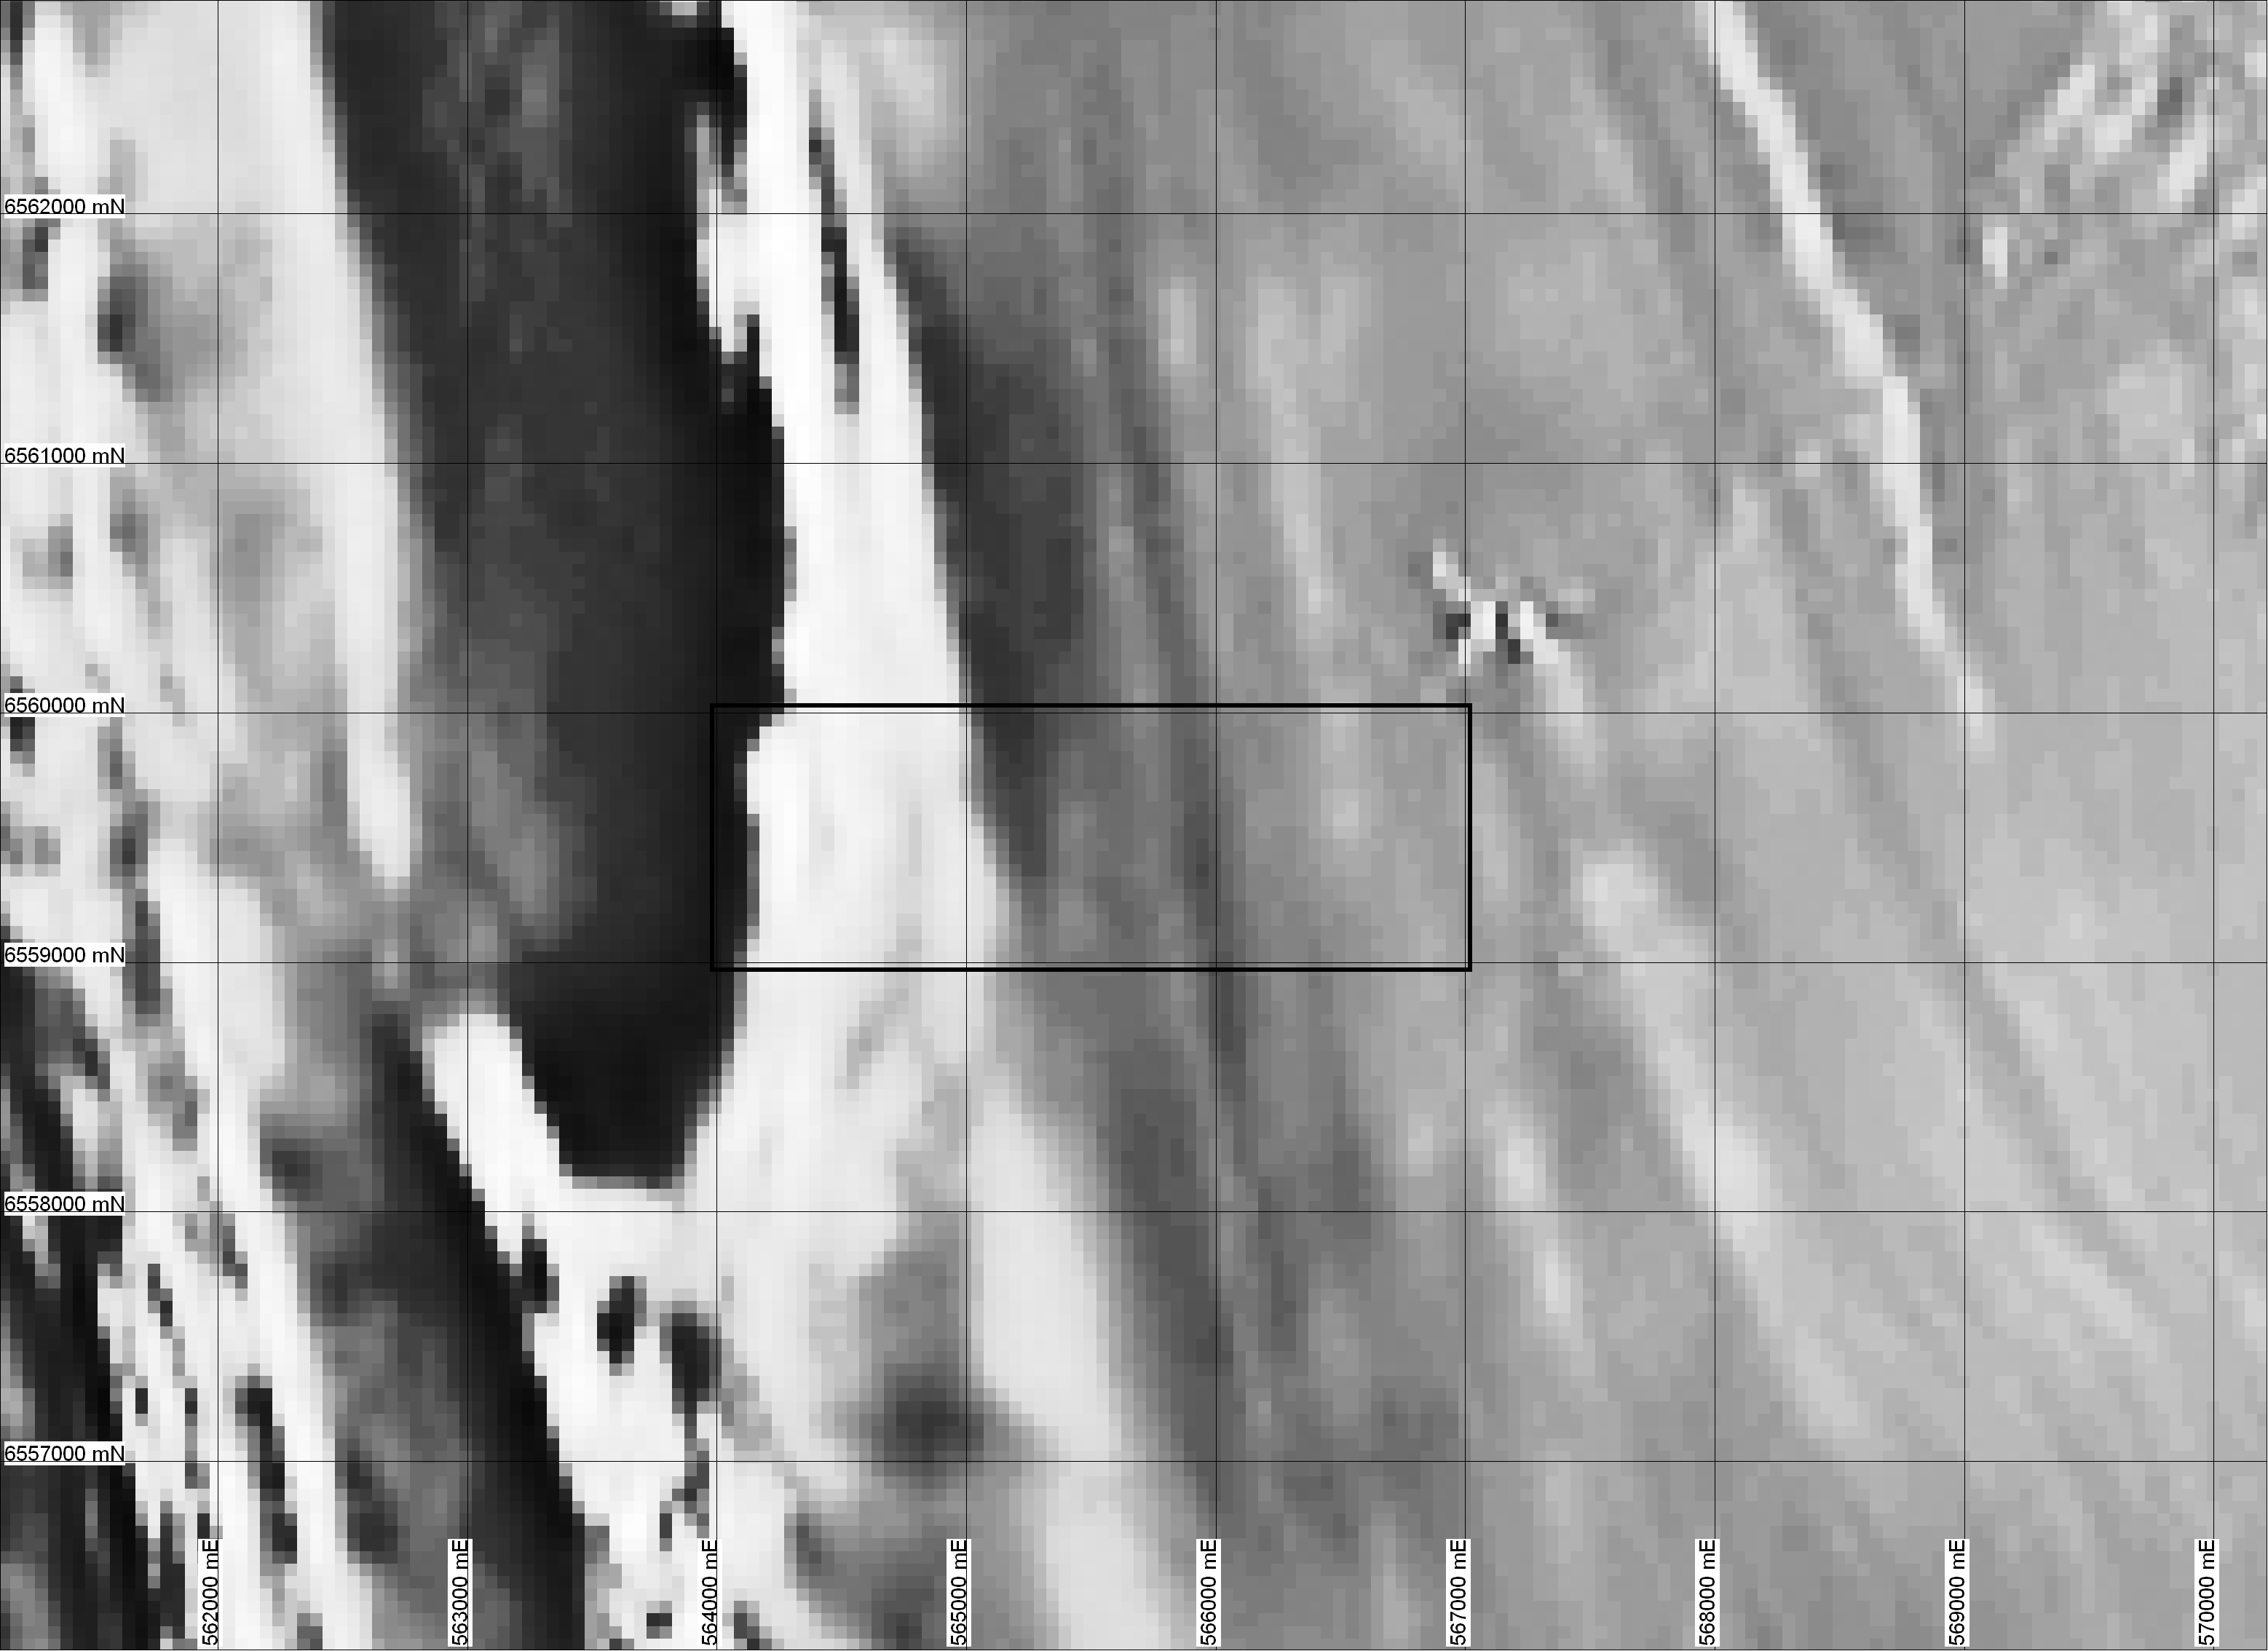 |
1VD aeromagnetics (300
dpi jpg, 1.0 Mb) First Vertical Derivative (or 1VD) magnetics is a Fourier function of the TMI magnetics. 1VD is a measure of the rate of change of the Earth's magnetic field and is useful for locating near-surface (regolith) magnetic features which have high amplitudes and short wavelengths. The buildings of Fowlers Gap Station are located in the upper right, and the remainder of the detail in this image seems to be related to Adelaidean bedrock, bedding striking NNW for the most part. Highly ferruginised Adelaidean bedrocks in the western part are also highlighted, as are weakly magnetic sediments in Fowlers Creek. This image comes from the New South Wales' Department of Primary Industry's Broken Hill Exploration Initiative (BHEI) Volume 2 dataset. |
 |
1:10,000 aerial
photo mosaic (300 dpi, 9.9 Mb) This is a rectified false colour aerial photo mosaic basemap of the 2007 mapping area. The mosaic is made up of photographs from the 1981 Qascophoto survey comprising colour, infra-red extended aerial photographs shot at 1:10,000 scale. The mosaic is rectified, which means it conforms loosely to ground coordinates using a "rubber sheeting" method based on ground control points from the 1:25,000 topographic sheets to warp the images together. The mosaic has a ground resolution of 1 m. |
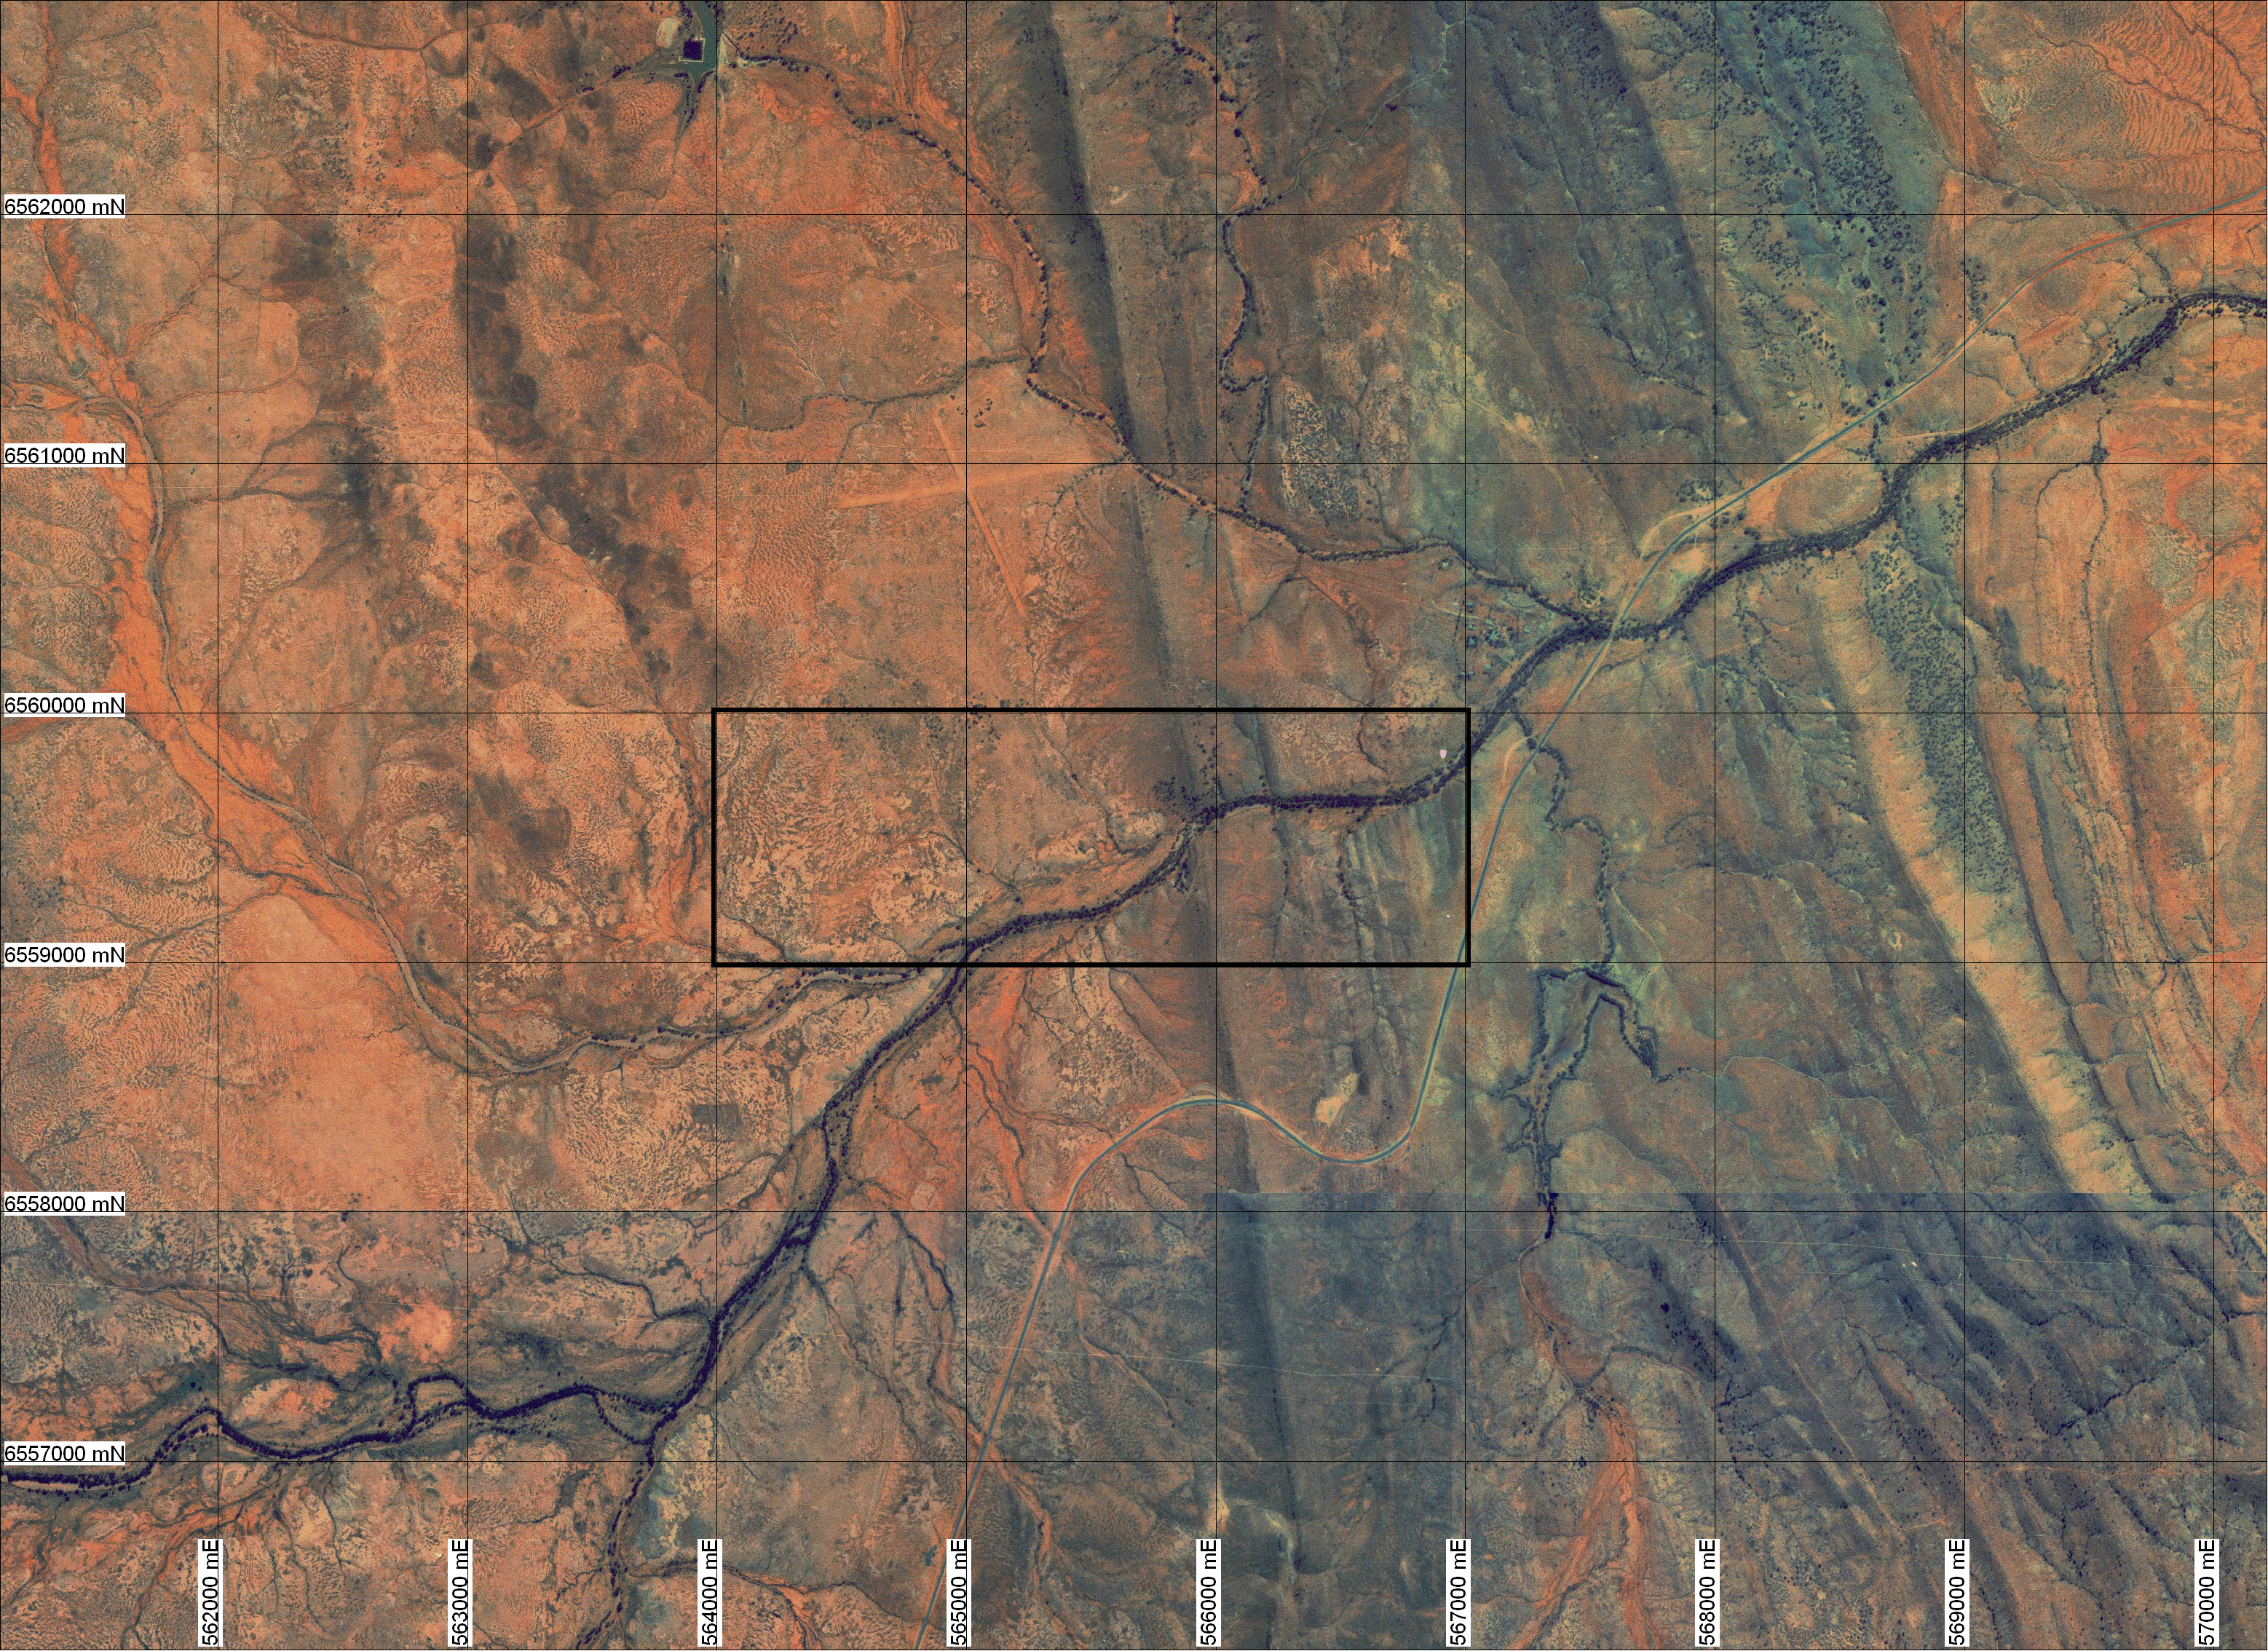 |
1:50,000 aerial
photo mosaic (300 dpi, 7.0 Mb) This is an orthorectified true colour aerial photo mosaic basemap of the 2007 mapping area. The mosaic is made up of 1:50,000 scale aerial photographs from the Fowlers Gap and Bancannia 1:100,000 sheets. The mosaic is orthorectified, which means that it conforms very closely to ground coordinates (RMS error < 5 m) by using a rectification method that includes the camera lens distortion parameters, ground control points and the SRTM DEM to warp the images to more closely reflect their true ground positions. The mosaic has a ground resolution of 3 m. |
|
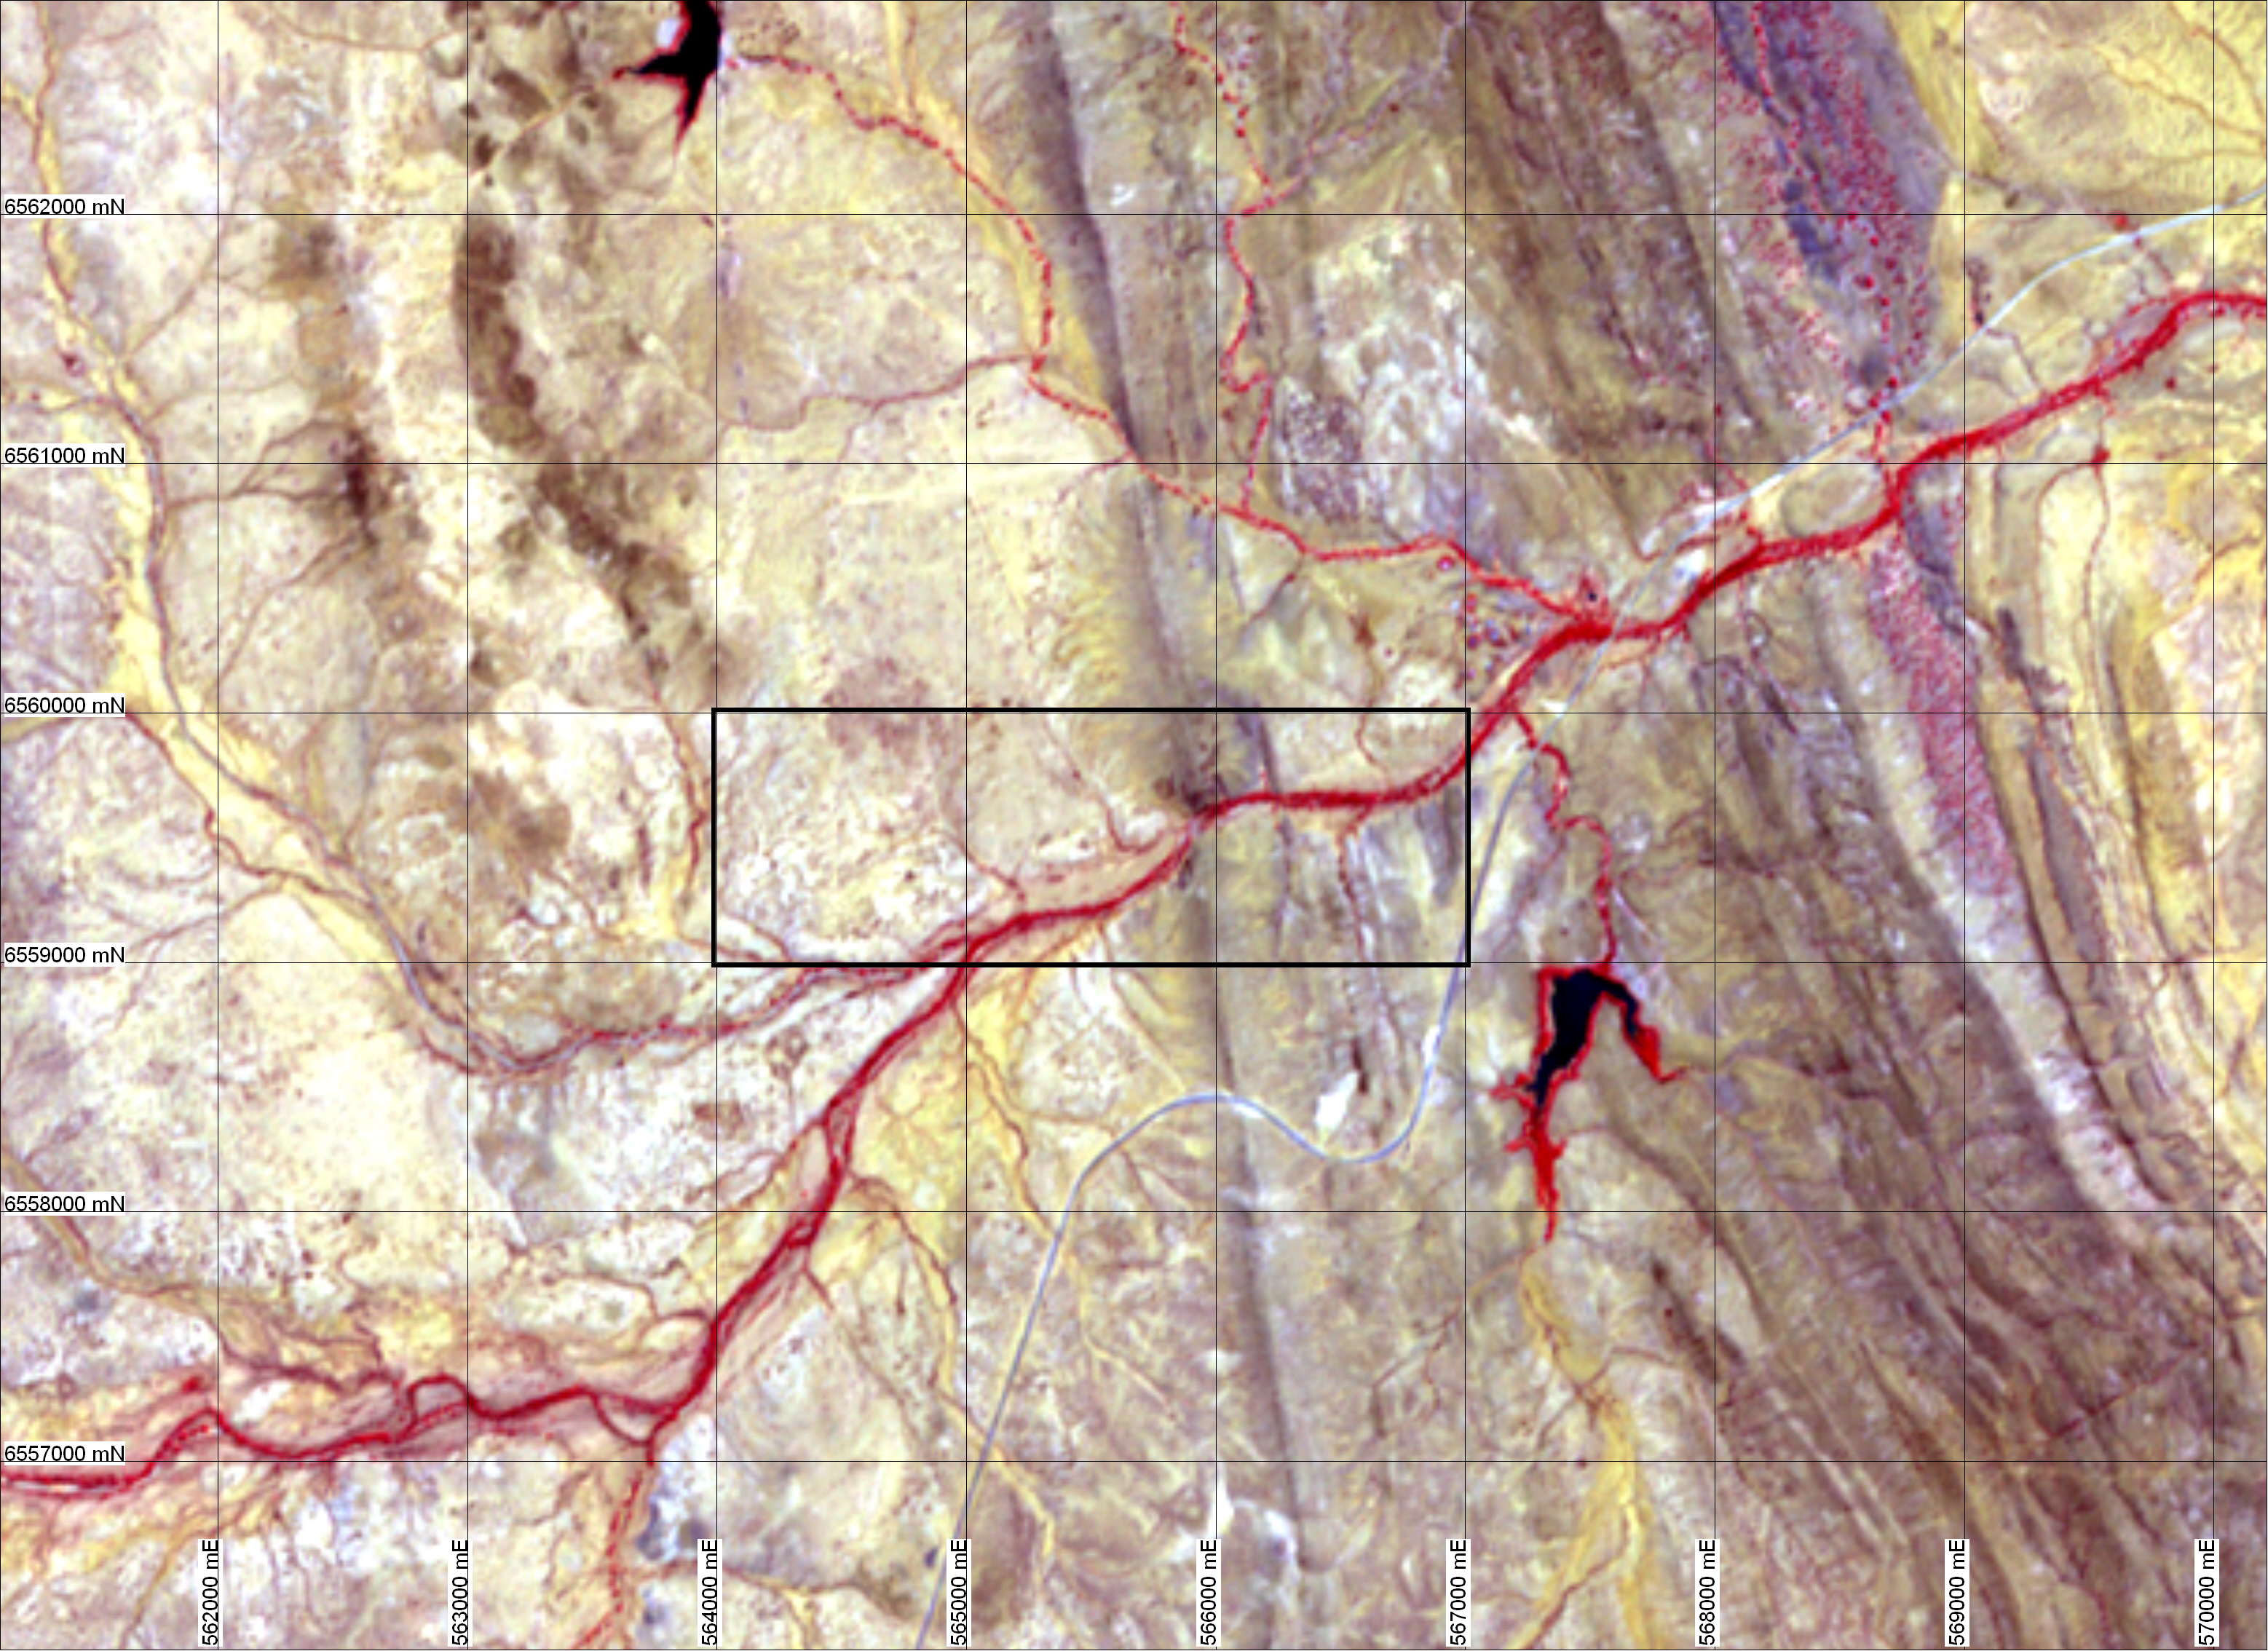
Image-processed ASTER images of Fowlers Gap, courtesy Bill Reid, NSW DPI The following images show examples of how ASTER images may be processed to highlight surface materials with different spectral, and therefore compositional, characteristics. |
 |
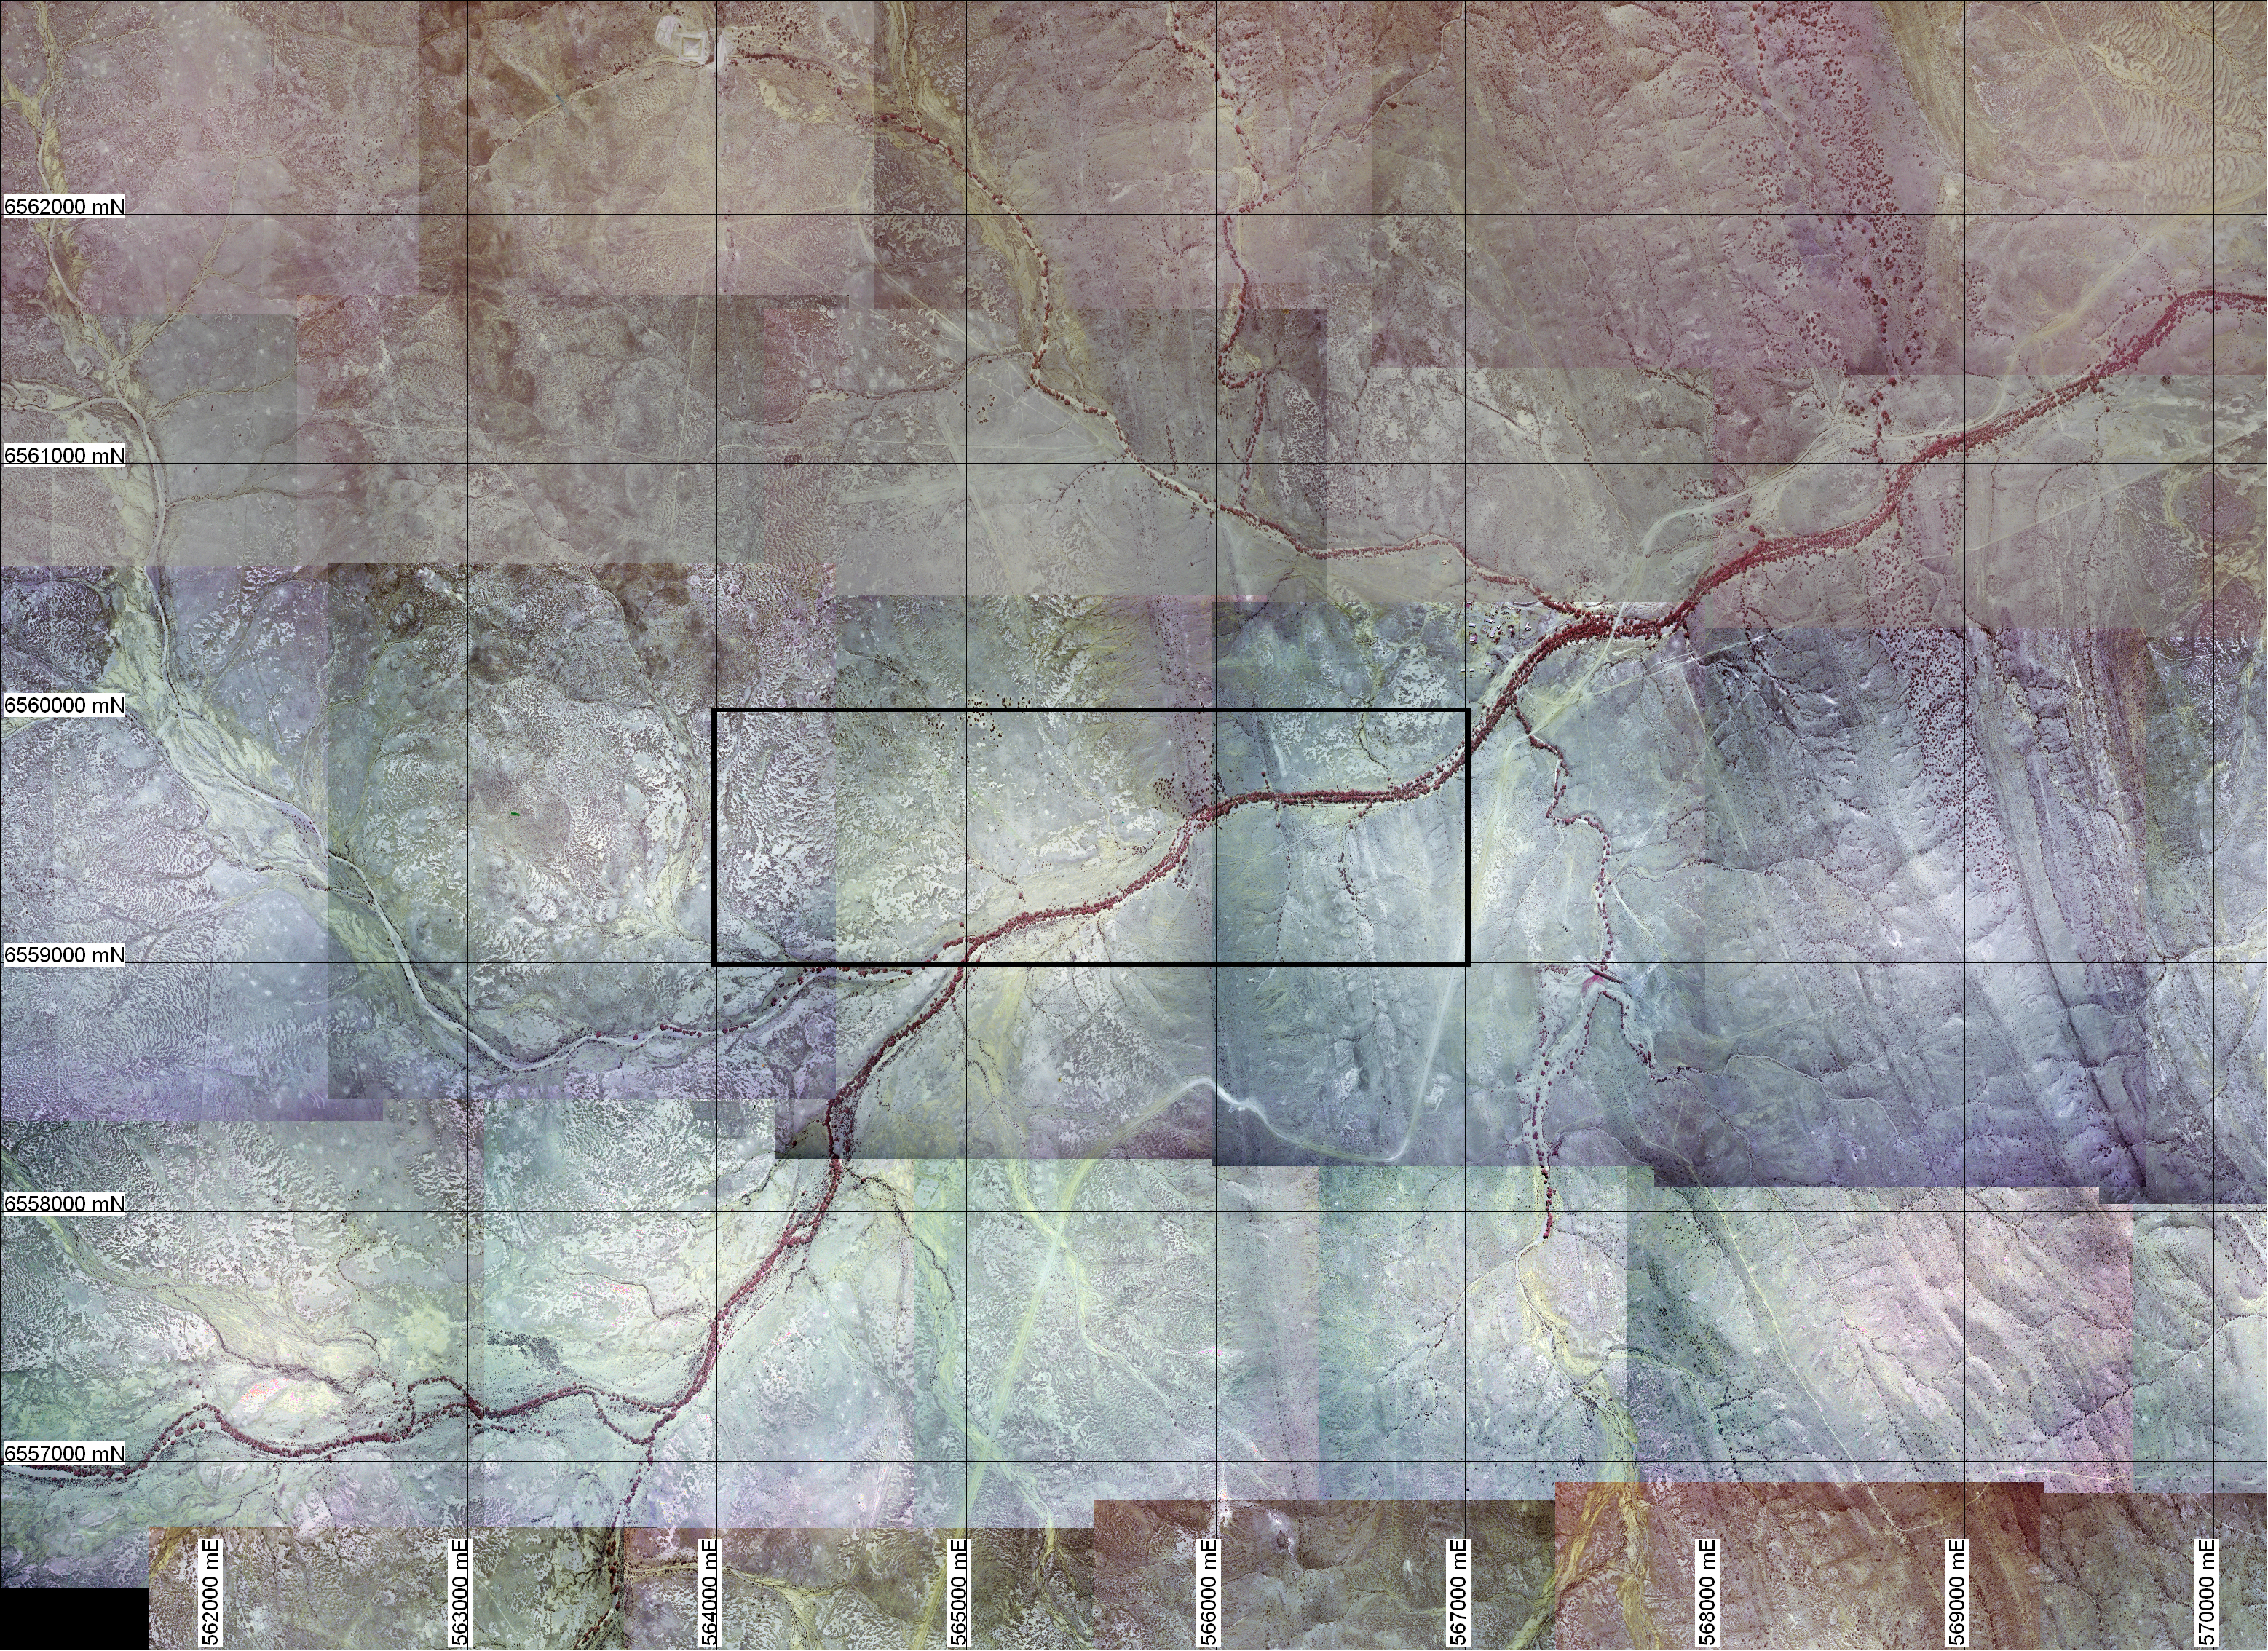
ASTER Bands 3N21 99% stretch
(300 dpi jpg, 6.4 Mb) ASTER (the Advanced Spaceborne Thermal Emission and Reflection Radiometer) is one of two instruments on the NASA TERRA satellite (the other being MODIS). ASTER senses 14 bands from visible near infra-red to thermal infra-red and has resolutions varying from 15 m (VNIR) to 90 m (TIR). ASTER is extremely useful for mapping regolith and vegetation in the arid and semi-arid zones at scales as high as 1:25,000 (where it become a little pixelated). This image has a 99% histogram stretch (performed using ER-Mapper) and depicts vegetation growing along drainage and different surface materials. It highlights alluvial fans sheeting off the Fowlers Gap uplands into the Bancannia Trough to the east. This image comes from the NASA LP-DAAC. |
 |
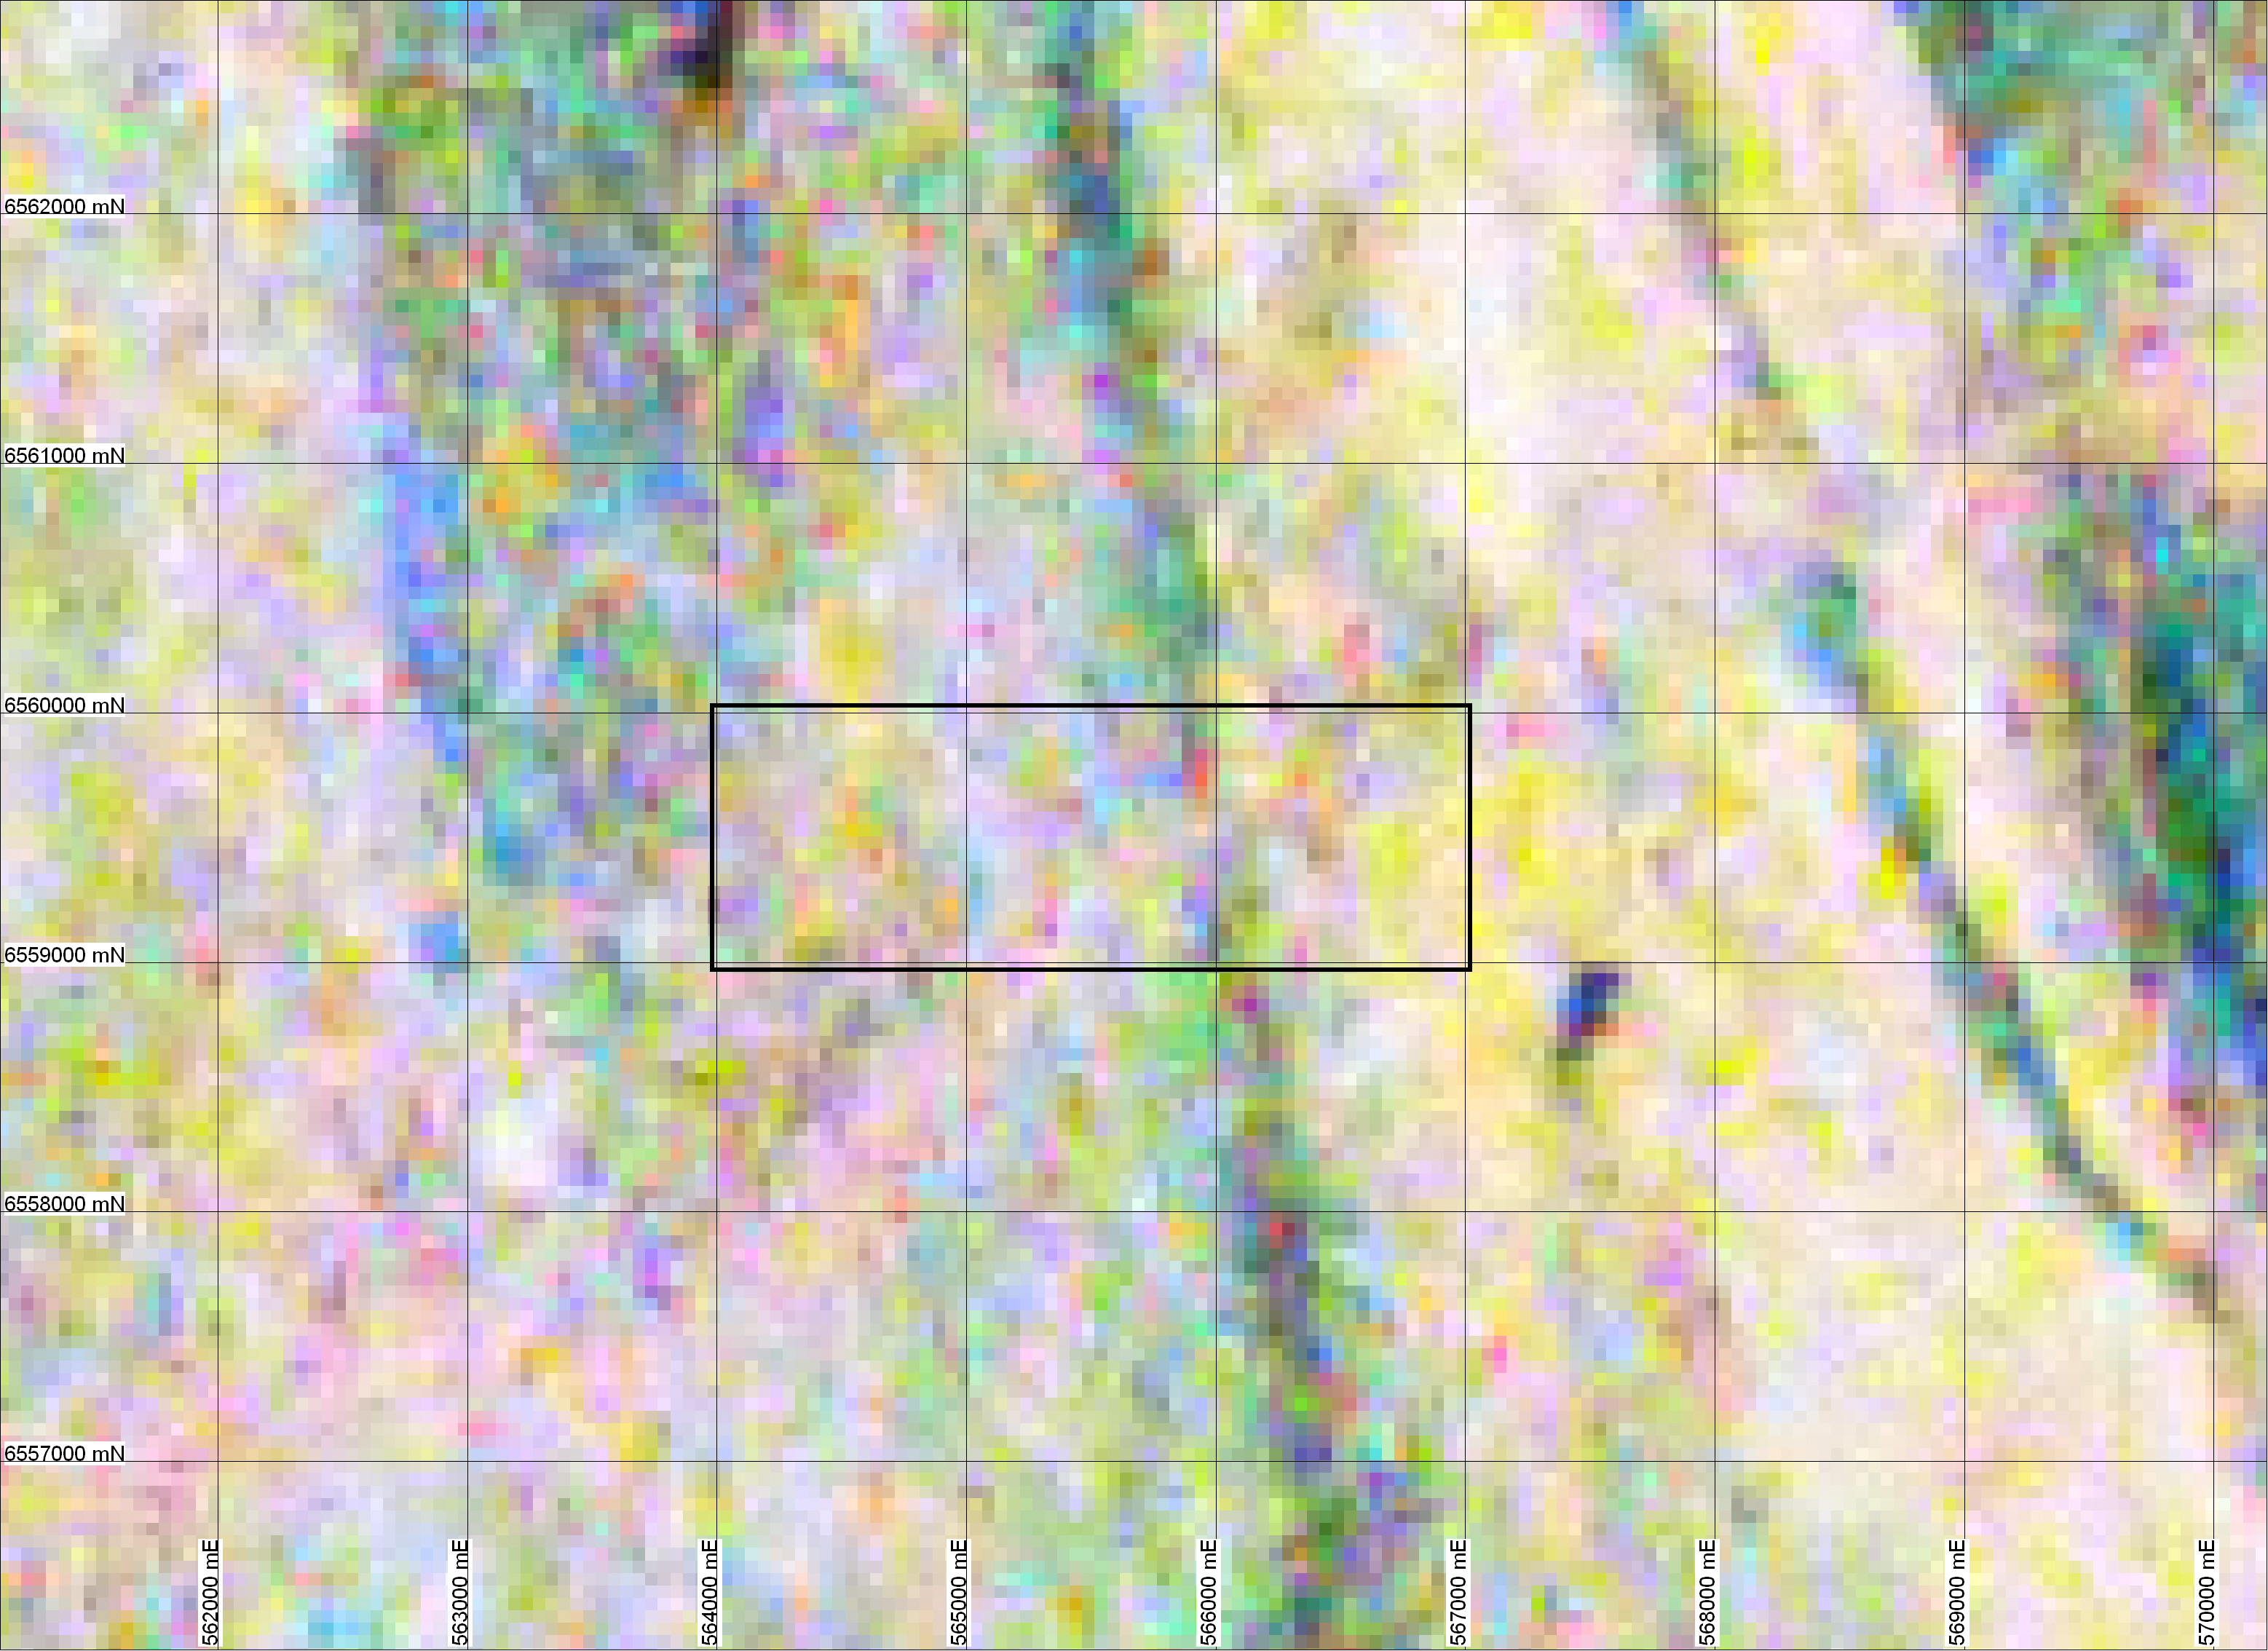
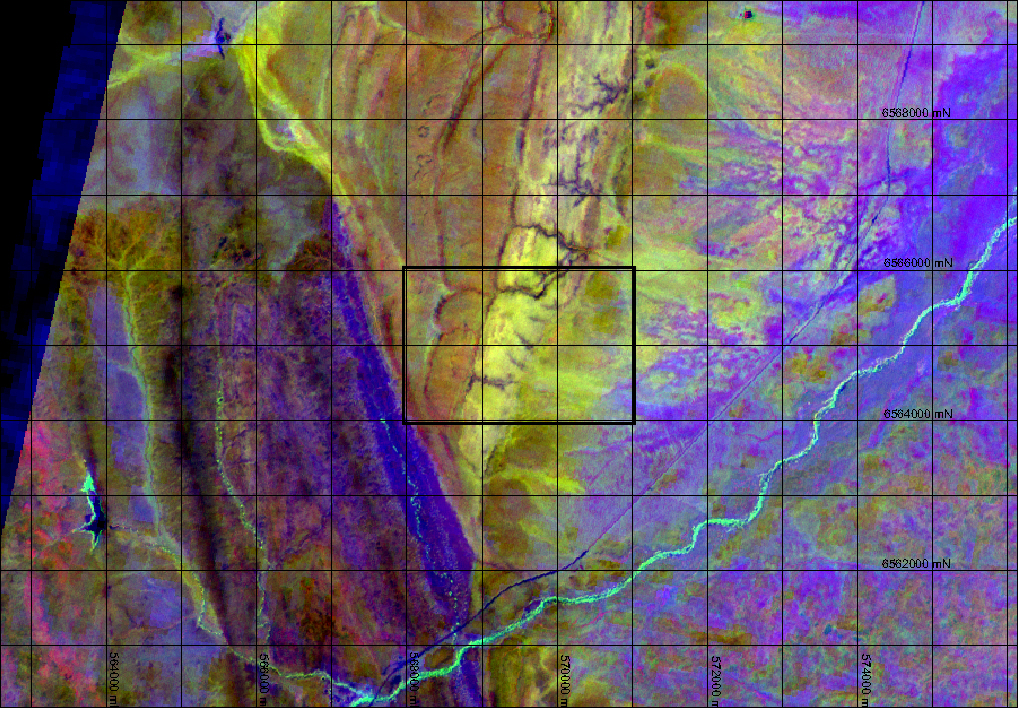
ASTER Geological
Discrimination image (96 dpi jpg, 1 Mb) ASTER is a very versatile sensor and here an image has been processed to help regolith with different compositions. The image highlights different weathering grades within in situ regolith, incision along the ephemeral creek lines and the sources and sinks of the local surficial sediments. Image courtesy of Bill Reid, NSW Geological Survey. |
 |
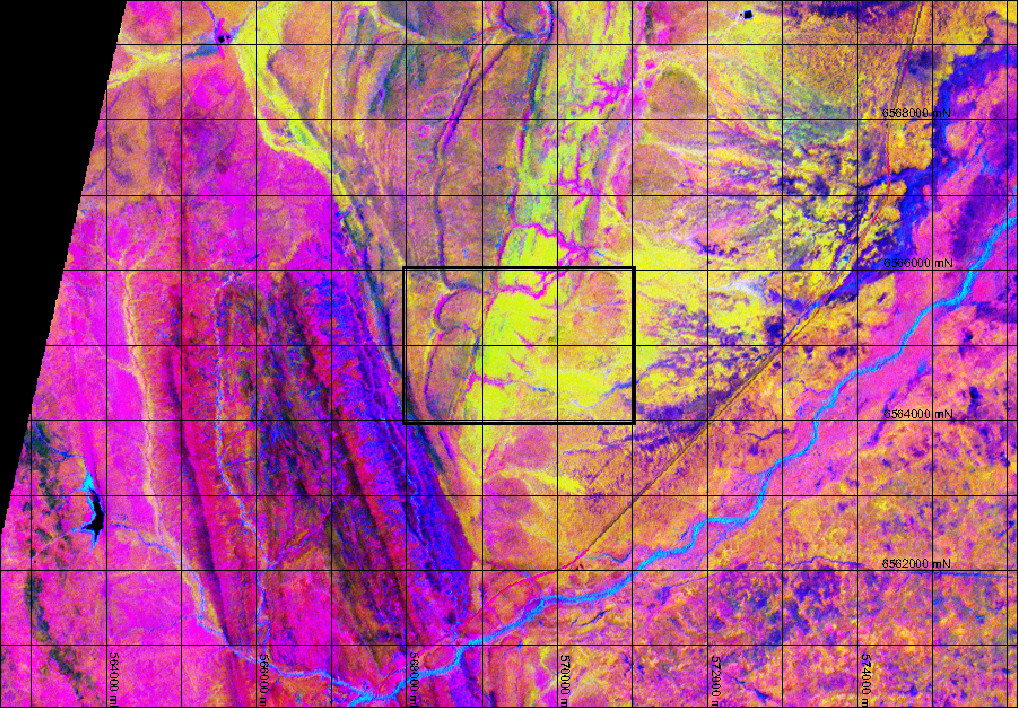
ASTER Principal Components
123 image (96 dpi jpg, 1 Mb) This image is of a Principal Component Analysis of ASTER bands 1, 2 and 3. Most remote sensing data are normally highly correlated and PCA decorrelates those data to produce new uncorrelated output bands. The PCA highlights the different regolith materials but also offers insights into the location of the Devonian-Cretaceous unconformity and the weathering grade of Cretaceous marine sediments present in the mapping area. Image courtesy of Bill Reid, NSW Geological Survey. |
| Last modified December 10, 2008 20:05 |