News & Events
2003 News Archive
Use of Hyperspectral Data in Regolith Mapping
Dr A.J.Mauger
CRC LEME Mineral Mapping SA
Gawler Craton Team
Geological Survey Branch
Hyperspectral data approximate continuous reflectance/emittance
spectral measurements over a selected interval of the electromagnetic
spectrum. Data in the visible to short-wave infrared region can
now be acquired from airborne and satellite platforms that provide
a full spectrum recorded for every pixel in the spatial image. Spectra
can be examined for individual absorption features caused by specific
chemical bonds in any solid, liquid, or gas. All materials are formed
by chemical bonds and therefore have the potential to be detected
by spectroscopy. Actual detection is dependant on spectral coverage,
spectral resolution, signal-to-noise characteristics of the spectrometer,
the abundance of the target material, and the relative strength
of the absorption features for that material in the wavelength region
being measured. Spectroscopy can be used in laboratories on hand
specimens, drill hole cuttings and core samples, in the field with
portable field spectrometers, from aircraft, and from satellites.
In remote sensing applications, the surface materials mapped must
be exposed in the optical surface (eg. to map surface mineralogy
it must not be covered with vegetation), and the diagnostic absorption
features must be in regions of the spectrum that are reasonably
transparent to the atmosphere (adapted from http://speclab.cr.usgs.gov/aboutimsp.html).
Spectral mineral logging and mapping provides the geologist analysing
regolith with objective information on the spatial distribution
of particular minerals generated and dispersed by regolith forming
processes. The advent of hyperspectral scanners with high signal-to-noise
characteristics over 100 or more bands in the visible to short-wave
infrared part of the electromagnetic spectrum, now provides the
opportunity for objective surface mineral mapping. The problem of
atmospheric interference with the signal reflected from the target
has been addressed by including specific bands to measure the atmospheric
water column on a per pixel basis. With this information the effects
of atmosphere can be modelled and removed from the signal at the
pixel level. The spectral resolution of the scanners is such that
minerals can be discriminated using laboratory determined diagnostic
absorption features at a resolution of separation of around 20nm.
Hyperspectral data acquisition has been developed to the stage where
our limited ability to model all the natural processes in the system
constitutes the primary impediment to the accurate delineation of
mineral species in the environment.
Hyperspectral data can be classified according to the platform
of acquisition which can also be linked to the scale of observation.
Hyperion
is the first hyperspectral instrument to be launched on a satellite
platform. With 30m pixel size, 7.7km swath width, 40km image length
and 220 channels, Hyperion has proved the technology for the next
generation of remote sensing satellites.
HyMap is an Australian
built airborne system with 128 channels between wavelengths 450
and 2500nm. Depending on the height flown, 3m pixels with 1.5km
swaths in 25-30km runs are possible although a more usual configuration
of 5m pixels with 2.5km swaths flying at 2 km and allowing a 500m
overlap between runs produces a manageable dataset.
In order to ground truth air- and space-borne instruments a portable
field spectrometer covering the same wavelengths is required. One
such instrument, the ASD
Field Spec, which covers the spectral ranges of Hyperion and
HyMap, relies on external illumination. Another, the PIMA
II SP (Portable Infrared Mineral Analyser), utilises an internal
light source and calibration target allowing it to operate under
a broader range of conditions than the ASD Field Spec. Although
the PIMA only covers the wavelength range 1300-2500nm this portion
of the spectrum includes diagnostic absorption features for many
common minerals. The prototype
CSIRO Core Logger provides continuous spectral information along
core with a 450-2500nm spectrum recorded at 1 cm intervals. By arranging
the mineralogical results in their relative 3D orientation, spatial
relationships can be investigated and volumetric studies undertaken.
Mineral groups detectable with these systems include:
• Clays |
• Amphiboles |
• Phosphates |
• Carbonates |
• Hydroxides |
• Borates |
• Sulphates |
• Evaporites |
• Zeolites |
Typical minerals include:
• Kaolin |
• Alunite |
• Actinolite |
• Muscovite |
• Jarosite |
• Calcite |
• Illite |
• Chlorite |
• Dolomite |
• Pyrophyllite |
• Talc |
• Magnesite |
• Smectites |
• Epidote |
• Gypsum |
Within a particular mineral solid solution series geochemistry
might also be identified based on subtle features of the reflectance
spectra. For example the sodium-potassium content of white mica
can be estimated by examining the position of the 2200nm absorption
feature which shifts to lower wavelengths with increasing sodium
substituting for potassium.
Geologists depend on aerial photographs for regional mapping. Much
of their work involves interpreting the photos for lithological
units and geological structure. Detailed field mapping typically
involves both transects across strike and the delineation of lithological
boundaries by following contacts. If a surface material is not distinctive
in the photography a geologist risks errors of omission because
it is often not feasible to examine every outcrop on foot. Hyperspectral
imagery provides a synoptic overview with the additional perspective
of mineralogical information. Now it is possible to interpret and
map mineral alteration that cuts across lithological boundaries
and to recognise variation in weathering intensity by the appearance
or absence of particular minerals and their relative abundance.
Issues with mapping regolith include the omission of unrecognised
saprolite outcrop and the discrimination of transported deposits
from in-situ regolith. Hyperspectral imagery offers the opportunity
to map previously unrecognised saprolite and to map alteration mineral
distribution patterns visible at the surface. Mineralogical variation
may be significant in mapping regolith where unit boundaries are
often less distinct and low angled deposits tend to coalesce.
To the geologist studying the regolith the issue becomes one of
modelling the mineral systems under consideration and then using
the appropriate tool on the appropriate platform to provide the
necessary information.
Spectral logging is proving to be an effective technique for logging
regolith units. In documenting the regolith profile it is important
to log those minerals that survive the weathering process with an
indication of the point in the profile where they disappear and
what new minerals form during weathering. The 3D element dispersal
train is also valuable to ascertain. The strength of the CSIRO Automated
Core Logger lies in the capacity to measure large volumes of contiguous
material in a short space of time. Using core gathered over a recognised
deposit, element dispersion models can be linked to mineralogical
changes identified as marking different stages in the development
of the regolith.
Developments in hyperspectral data acquisition and analysis are
advancing rapidly. The regolith geologist has the opportunity to
avail themselves of these developments thus adding another dimension
to their understanding of regolith forming processes.
In order to maximise utilisation of this tool CRC LEME offers annual
workshops for CRC LEME participants. The next workshop is scheduled
for 21-25 July 2003 at the University of Adelaide, South Australia.
For details contact Alan Mauger, Geological Survey Branch, Minerals
Petroleum & Energy, Primary Industries and Resources SA, p:
+61-8-84633062, f: +61-8-82263200, e: mauger.alan@saugov.sa.gov.au
or Pat James, University of Adelaide, p (dir): 61 (0)8 8303 5254
p (mob.):0403028004 p (sec): 61 (0)8 8303 5376 f: 61 (0)8 8303 4347
e: patrick.james@adelaide.edu.au.
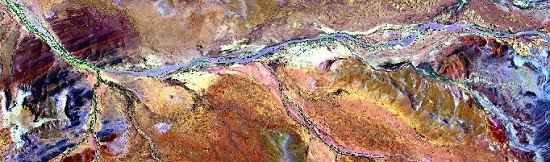
 A
2.5km wide strip of HyMap imagery from the Willouran ranges in South
Australia. Carbonate materials are shown in blues and purples while
siliclastic materials appear as oranges and reds. Vegetation is
displayed as green. One can very clearly identify and determine
the source of the dominant mineral class in the stream sediments
and outwash plains. A
2.5km wide strip of HyMap imagery from the Willouran ranges in South
Australia. Carbonate materials are shown in blues and purples while
siliclastic materials appear as oranges and reds. Vegetation is
displayed as green. One can very clearly identify and determine
the source of the dominant mineral class in the stream sediments
and outwash plains.
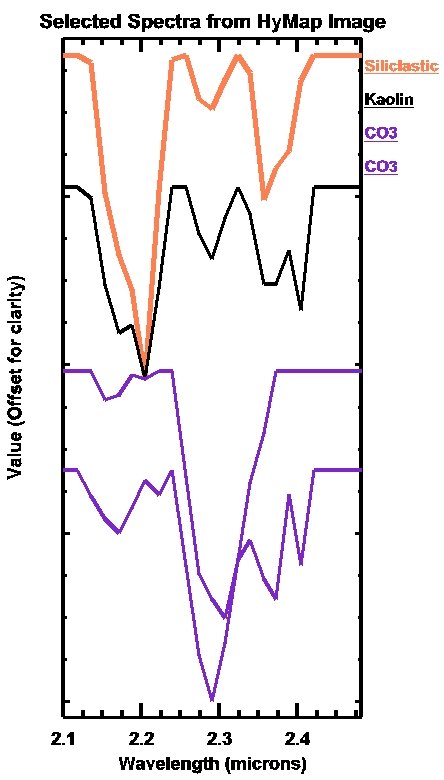
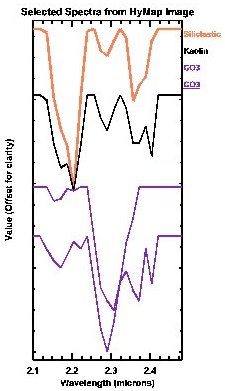
The accompanying spectral plot of selected pixels from this image
demonstrates the ability of an airborne hyperspectral scanner to
acquire high quality mineral spectra. A mesa of residual Tertiary
material overlying the steeply dipping Proterozoic sediments is
apparent in the lower left of the image.
(Click on images to enlarge them)
For further information see: J.L. Keeling and A.J. Mauger, 2000:
"Application of Airborne Hyperspectral (HYMAP) Data to Map Variation
in Carbonate Facies in Proterozoic Skillogalee Dolomite, Willouran
Ranges, South Australia." 10th Australasian Remote Sensing
and Photogrammetry Conference, Adelaide, 2000.
A 2.5km wide strip of HyMap imagery from
the Willouran ranges in South Australia. Carbonate materials are
shown in blues and purples while siliclastic materials appear as
oranges and reds. Vegetation is displayed as green. One can very
clearly identify and determine the source of the dominant mineral
class in the stream sediments and outwash plains.
The accompanying spectral plot of selected pixels from this image
demonstrates the ability of an airborne hyperspectral scanner to
acquire high quality mineral spectra. A mesa of residual Tertiary
material overlying the steeply dipping Proterozoic sediments is
apparent in the lower left of the image.
(Click on images to enlarge them)
For further information see: J.L. Keeling and A.J. Mauger, 2000:
"Application of Airborne Hyperspectral (HYMAP) Data to Map Variation
in Carbonate Facies in Proterozoic Skillogalee Dolomite, Willouran
Ranges, South Australia." 10th Australasian Remote Sensing
and Photogrammetry Conference, Adelaide, 2000.
|